Category: Orange County Real Estate Market

  • Orange County Market Report: Costa Mesa & Cypress

    Next in our city-by-city series: Costa Mesa and Cypress. Both run well above the national rent average, but they get there in different ways — one through a premium coastal-adjacent apartment market, the other through a smaller, more owner-occupied rental pool.
    Costa Mesa: one of the priciest apartment markets in the county

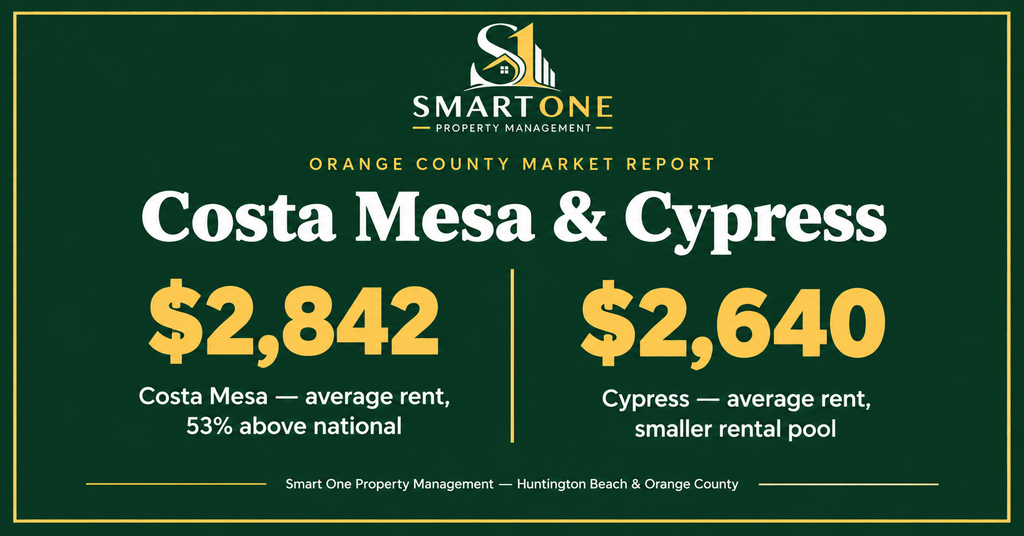
    Costa Mesa’s average apartment rent runs around $2,842, per RentCafe’s 2026 data, with the citywide median across all property types closer to $3,006. Rent here sits roughly 53% above the national average, and 35% of rentals in the city — the largest single share — go for $3,000 or more per month. Two-bedroom units average around $3,181, and three-bedrooms push past $3,500.

    For owners, Costa Mesa is a market where premium pricing is genuinely supported by demand — but it also means a property that’s even slightly overpriced relative to true comparables will be competing directly against a large pool of similarly priced, well-maintained units.

    Cypress: a smaller rental pool with mixed signals

    Cypress tells a more complicated story. Rent estimates vary more here than in most cities we’ve covered — RentCafe puts the average around $2,640 (up modestly year-over-year), while another source shows a notably higher $2,830 average that’s actually down about 10% from a year ago. That kind of divergence usually points to a smaller sample size or a shift in the mix of available units, rather than a single clean trend, so these figures should be treated as more directional than precise for Cypress specifically. One-bedrooms average around $2,311, two-bedrooms around $2,856.

    What’s clearer is the composition of the city itself: only about 32% of Cypress households are renter-occupied, compared to 68% owner-occupied — a notably higher owner-occupied share than most cities in this series so far. That points to a smaller, tighter rental pool overall, which can work in an owner’s favor (less direct competition) but also means fewer comparable listings to price against with confidence.

    What this means if you own in either market

    In Costa Mesa, lean on solid comparables in a genuinely competitive, premium apartment market — the ceiling is real, but so is the competition at that price point. In Cypress, be more cautious about which data source you’re trusting for pricing, and factor in that a smaller rental pool means less room for error if a unit is priced outside what the limited comparable set supports.

    Neither city had reliable vacancy-specific data available in this search; as a directional reference, Orange County’s broader multifamily vacancy rate has been running around 4.0–4.3% in 2026, per the Kidder Mathews data cited in our earlier countywide report.

    Own a rental in Costa Mesa, Cypress, or elsewhere in Orange County and want to know how your property compares to current market data? Reach out to Smart One Property Management.

    Sources: RentCafe, Average Rent in Costa Mesa, CA; RentCafe, Average Rent in Cypress, CA; Zillow Rental Manager, Average Rental Price in Cypress, CA.
  • Starter Homes Are Getting Scarcer Nationally. In Orange County, the Math Is Even Tighter.

    “Starter home” implies something entry-level and attainable. Nationally, that’s increasingly a stretch — and in Orange County, the term barely applies at all.

    The national starter home picture

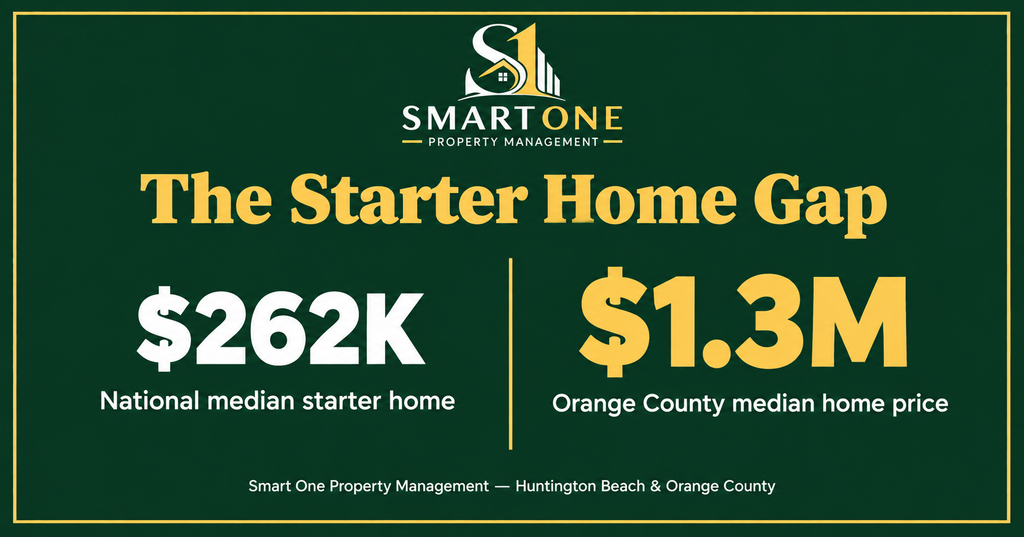
    The median U.S. starter home costs around $262,317 as of 2026, requiring roughly $70,000–$80,000 in household income to afford comfortably, according to Redfin’s data. The good news, such as it is: affordability has been improving slightly faster than the overall market, and the income needed to afford a starter home has been falling since late 2025. The harder truth is inventory — the share of listings that qualify as “starter homes” has dropped from about 70% in 2019 to roughly 55% in 2026. There are simply fewer entry-level homes coming to market than there used to be, even as affordability inches in the right direction.

    Orange County’s version of this problem is much steeper

    Orange County’s median home price has climbed past $1.3 million, more than five times the national starter home figure. Only about 18% of Orange County households can afford a median-priced home in the county, and prices here run roughly 172% above the national average. Inventory tells a similar story: the county is still missing about 26% of the homes that would normally reach the market compared to pre-pandemic (2017–2019) levels — a real improvement from being down 41% in 2023, but still a meaningfully thinner market than buyers saw just a few years ago.

    Where Orange County’s actual entry points are

    “Starter home” in Orange County doesn’t mean cheap — it means relative. Cities like Santa Ana, Stanton, Garden Grove, Buena Park, La Habra, Anaheim, and Westminster consistently fall below the county median, with Anaheim averaging around $920K and Garden Grove around $970K. These cities tend to share a few traits: older housing stock, a higher share of condos and townhomes, and fewer coastal price premiums. For a first-time buyer priced out of Newport Beach or Huntington Beach, these cities are where realistic options actually exist.

    What this means for rental property owners

    When entry-level buyers get squeezed this hard, the effect shows up directly in the rental market. Would-be first-time buyers who can’t clear Orange County’s affordability bar don’t disappear from the housing market — they stay renters for longer, often in the same entry-point cities where they’d otherwise be shopping to buy. That’s a meaningful signal for owners with rental property in Santa Ana, Garden Grove, Buena Park, Anaheim, or similar submarkets: sustained demand from exactly the renter segment least likely to transition to homeownership anytime soon.

    This connects to the pattern we’ve tracked in recent posts on mortgage rates and rental demand — buyers on the sidelines, for whatever reason, tend to become longer-term renters, and Orange County’s starter home math is one more structural reason that dynamic isn’t going away quickly.

    The takeaway

    Nationally, starter homes are scarce but slowly improving. In Orange County, the scarcity is far more extreme, and the “starter” label really only applies in a handful of specific cities rather than the county broadly. For owners, that reinforces where rental demand is likely to stay durable — precisely the cities first-time buyers are being priced out of.

    Own a rental in one of Orange County’s more accessible entry-point cities and want to know how current demand affects your pricing? Reach out to Smart One Property Management.

    Sources: Redfin, Starter Home Market Data Center; Redfin, First-Time Buyers Catch a Break as Affordability Improves; firsttuesday Journal, Orange County Housing Indicators.

  • Mortgage Rates Just Hit a 2026 High. Here’s What That’s Doing to Demand.

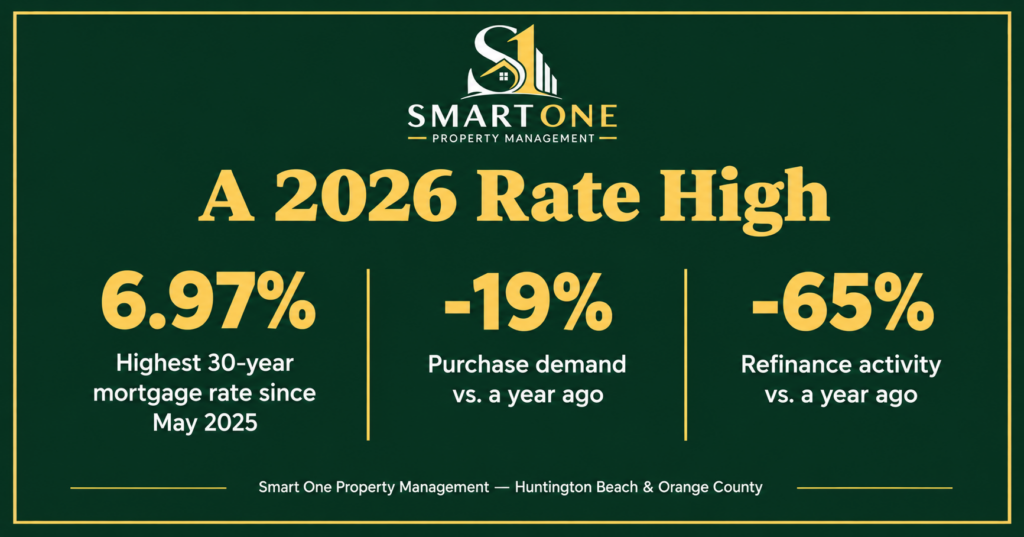
    Mortgage rates climbed to 6.97% in mid-September — the highest level since May 2025 — and the latest data from the Mortgage Bankers Association shows exactly what that’s doing to demand. Total mortgage application volume fell 4.1% in a single week, purchase applications dropped another 1% and sit roughly 19% below year-ago levels, and refinance activity has nearly stalled out entirely, down 65% compared to a year ago.

    Purchases: sidelined buyers, again

    This continues the pattern we flagged a few weeks ago when purchase demand was already down 5% year-over-year at a 6.78% rate. Since then, rates have climbed further and purchase demand has softened further with them — a fairly direct relationship. Every basis point increase in rate pushes another slice of would-be buyers to either wait, adjust their budget downward, or stay renters for longer than they’d planned.

    Refinancing has nearly stopped

    The more striking number here is refinancing, now making up just 39.4% of total applications and down 65% from a year ago. This isn’t really a story about rates being “too high” in an abstract sense — it’s about the huge share of homeowners who locked in rates well below 6.97% in prior years and have zero financial incentive to refinance into something higher. Refinance activity effectively requires today’s rate to beat a homeowner’s existing rate, and for most current homeowners, it doesn’t come close.

    What this means for rental owners

    The purchase-side story is the more relevant one for rental property owners: as long as rates keep buyers on the sidelines, rental demand has a structural tailwind, since people who’d otherwise be buying stay renters for longer. We covered this dynamic in more detail in our earlier post on mortgage rates and rental demand — the core logic hasn’t changed, it’s just intensified as rates have climbed further this month.

    The refinance freeze matters too, in a quieter way. It means existing homeowners — including rental property owners with a mortgage locked in below 5% or 6% — have very little reason to touch their financing right now. If you’re holding a rate from a couple of years ago, this environment is a reminder that your existing loan is worth more than it might feel like day to day.

    What to watch going forward

    Weekly mortgage data moves fast and can reverse quickly, so a single week’s numbers are a data point, not a forecast. What’s worth tracking is the trend: rates have moved from 6.78% to 6.97% in about three weeks, and purchase demand has softened alongside it each time. If that trend continues, expect rental demand to keep benefiting from buyers staying on the sidelines — but if rates reverse and start coming down, that dynamic could shift relatively quickly too.

    Want help thinking through what today’s rate environment means for your specific property or portfolio? Reach out to Smart One Property Management.

    Source: Mortgage Bankers Association, Mortgage Applications Decrease in Latest MBA Weekly Survey, week ending September 11, 2026.

  • Orange County Market Report: Brea & Buena Park

    Continuing our city-by-city series covering every market in Orange County, this report looks at Brea and Buena Park — two neighboring North County cities with rents close enough to invite comparison, but different enough in composition that the comparison is worth digging into.

    Brea: pulled up by a mix of larger homes

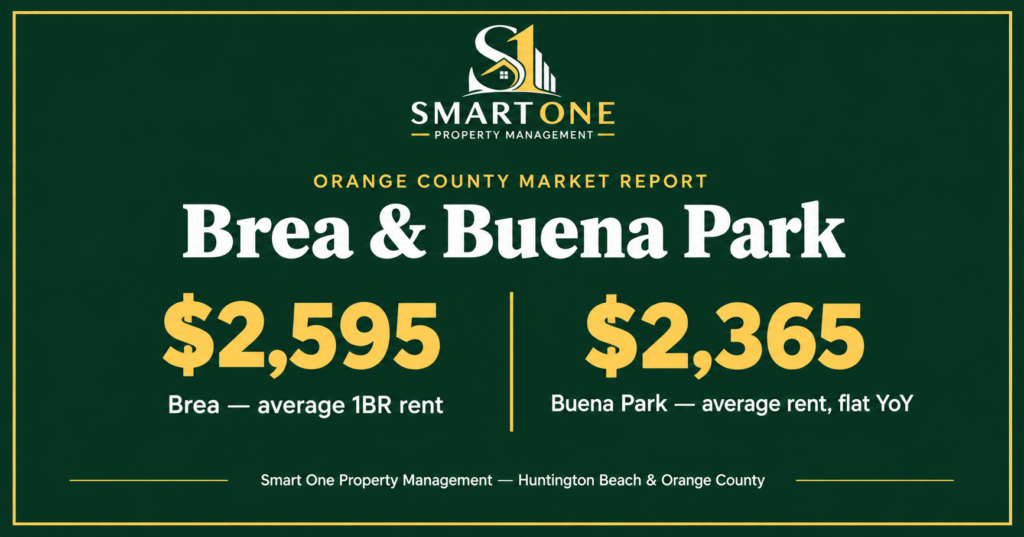
    Brea’s apartment rents run in the mid-$2,500s — RentCafe and Zillow both put one-bedroom units around $2,595–$2,597, with two-bedrooms closer to $2,965. But the citywide median rent across all property types (including single-family homes) is reported closer to $3,200, a meaningful gap from the apartment-only figures. That spread suggests Brea’s rental market is a genuine mix — a solid apartment stock alongside a meaningful share of single-family rentals pulling the overall median higher.

    For owners, that mix matters: comparing your property to a single citywide “average” can be misleading in Brea specifically, since an apartment and a single-family rental are being pulled from very different parts of that average. Comparable-property pricing matters more here than in a more uniform apartment market.

    Buena Park: a steady, moderately priced market

    Buena Park’s average rent sits closer to $2,333–$2,397, with the largest share of rentals — about 46% — falling in the $2,001–$2,500 range. Rent growth has been modest, around 0.35% year-over-year, essentially flat. Renter-occupied households make up about 44% of the city, a fairly even split with owner-occupied homes, which points to a stable, established rental base rather than a market in rapid transition.

    For owners, Buena Park looks like a consistency play — rents aren’t spiking, but they’re not softening either, and a well-priced, well-maintained unit in the dominant $2,001–$2,500 band should find qualified tenants without much friction.

    A vacancy data gap worth noting

    Neither city had reliable, city-specific vacancy rate data available in this search — a reminder that granular local data isn’t always published at the city level the way rent data is. As a reference point, Orange County’s broader multifamily vacancy rate has been running in the 4.0–4.3% range in 2026, per Kidder Mathews’ regional data cited in our earlier vacancy report. Absent city-specific numbers, that countywide figure is the best available baseline, though it should be treated as directional rather than precise for either Brea or Buena Park specifically.

    What this means if you own in either market

    In Brea, know which comparables you’re actually being measured against — apartment or single-family — before trusting a single average. In Buena Park, the story is less about volatility and more about disciplined pricing within a well-established, moderately priced band. Both are reminders that a citywide number is a starting point, not a pricing strategy — a principle that applies to every city in this series.

    Own a rental in Brea, Buena Park, or elsewhere in Orange County and want to know how your property compares to current market data? Reach out to Smart One Property Management.

    Sources: RentCafe, Average Rent in Brea, CA; Zillow Rental Manager, Average Rental Price in Brea, CA; RentCafe, Average Rent in Buena Park, CA; Zillow Rental Manager, Average Rental Price in Buena Park, CA.

  • Orange County Market Report: Aliso Viejo & Anaheim

    This is the first in an ongoing series covering every city in Orange County — two cities at a time, so owners can see how their specific submarket compares to the county as a whole. We’re kicking it off with Aliso Viejo and Anaheim: two cities in very different parts of the rent spectrum, for very different reasons.

    Aliso Viejo: a smaller, higher-end market

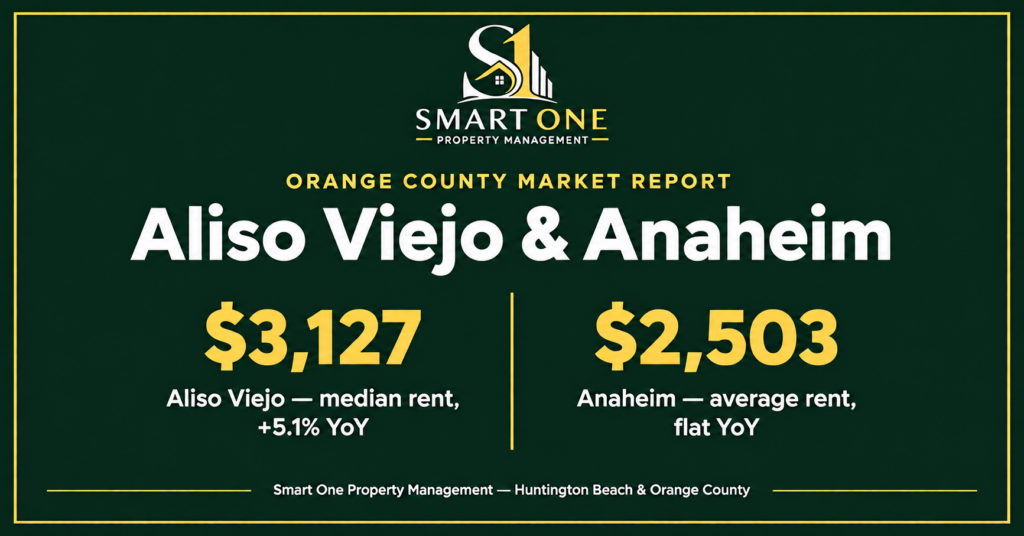
    Aliso Viejo’s rents have kept climbing through the year. Apartment List’s September 2026 report puts the citywide median at $3,127 — up 5.1% year-over-year — with one-bedrooms averaging around $2,808 and two-bedrooms closer to $3,763. That’s up from the roughly $3,275 average RentCafe reported earlier this year, suggesting the market has continued tightening rather than leveling off. Citywide vacancy data specific to this month wasn’t available in this check, but the underlying dynamics — a smaller, planned community with limited new apartment supply — still hold and continue to support the tighter pricing.

    For owners, that combination — steady rent growth, low vacancy, limited new supply — has generally kept Aliso Viejo a landlord-favorable market, though it’s also a market where pricing precisely matters more: with fewer total rentals than a larger city, a unit priced even slightly off-market can sit noticeably longer relative to the size of the rental pool.

    Anaheim: a larger, more moderate market

    Anaheim tells a different story, and one that’s held steady through September: average rent remains close to $2,503 per month according to Zillow’s rental market data (RentCafe puts it slightly lower, around $2,466), with the largest share of listings — still about 39% — falling between $2,001 and $2,500. Rent growth has stayed essentially flat year-over-year. According to RealPage’s 2026 analytics, Anaheim’s metro apartment market has historically run one of the lowest vacancy rates in the country, though occupancy softened somewhat through late 2025 before recovering roughly 30 basis points between April and June 2026. New supply is a factor to watch here too — the Anaheim metro is expected to add around 4,800 new apartment units in 2026, which tends to put some downward pressure on rent growth and give renters more options.

    For owners, Anaheim represents a larger, more liquid rental market with more comparable properties to benchmark against — generally easier to price correctly, but also more exposed to the effect of new supply coming online nearby.

    What this means if you own in either market

    Aliso Viejo rewards precision — a smaller pool of comparable rentals means pricing needs to be dialed in, but low vacancy and limited new supply generally work in an owner’s favor. Anaheim rewards owners who are tracking new supply closely, since a wave of new units nearby can shift the local balance of negotiating power even while citywide averages look stable.

    Either way, the same principle from our national-vs-local vacancy post applies here too: county-wide or citywide averages are a starting point, not a pricing strategy. What matters is the trend in your specific neighborhood and property type.

    Own a rental in Aliso Viejo, Anaheim, or elsewhere in Orange County and want to know how your property compares to current market data? Reach out to Smart One Property Management.

    Sources: Apartment List, September 2026 Aliso Viejo Rent Report; RentCafe, Average Rent in Aliso Viejo, CA (2026); Zillow Rental Manager, Average Rental Price in Anaheim, CA; RealPage Analytics, Anaheim’s Apartment Market Stable in 2026.